ARIMA vs. Machine Learning for Patent Trend Forecasting
Intellectual Property Management
Apr 28, 2026
ARIMA or machine learning? Evaluate strengths, limits and hybrid strategies to forecast patent filings with the right model.

Patent trend forecasting helps businesses and IP professionals predict filing volumes, plan budgets, and track innovation. Two popular methods for this are ARIMA and machine learning, often integrated into top patent tools for IP professionals. ARIMA models are simple, good for stable trends, and work well with smaller datasets. Machine learning, on the other hand, handles complex, non-linear patterns and integrates external variables but requires more data and computational resources.
Key Takeaways:
ARIMA: Best for linear, stable data; easy to interpret; limited with complex trends.
Machine Learning: Excels with large, dynamic datasets; handles external factors; harder to interpret.
Quick Comparison:
Feature | ARIMA | Machine Learning |
|---|---|---|
Data Size | Small datasets | Large datasets |
Complexity | Linear trends | Non-linear patterns |
Interpretability | High | Low |
Computational Needs | Low | High |
Best Use Case | Stable filing trends | Volatile or tech-driven trends |
Choosing between these methods depends on your data, goals, and resources. Sometimes, combining both offers the best results.
ARIMA vs Machine Learning for Patent Forecasting: Feature Comparison
How ARIMA Models Work for Patent Forecasting
The 3 Components of ARIMA
ARIMA stands for Autoregressive Integrated Moving Average, and each part contributes uniquely to analyzing patent data. The Autoregressive (AR) component reflects how current values are influenced by past values. This helps capture consistent trends, such as the momentum in patent filing volumes.
The Integrated (I) component focuses on stabilizing the data by differencing raw observations. This is particularly useful for handling non-stationary trends, which are common in patent data as filings often grow or shift over time. Meanwhile, the Moving Average (MA) component addresses the relationship between an observation and past error terms. By doing this, it smooths out short-term fluctuations or "noise" in the data.
"The ARIMA process states that the present value is dependent on past values, coming from the AR(p) portion, and past errors, coming from the MA(q) portion." - Nixtla
Together, these elements form the ARIMA(p, d, q) model, where:
p represents the number of autoregressive terms,
d indicates the level of differencing applied,
q refers to the number of moving average terms.
In simple terms, ARIMA models the present value of a differenced series as a combination of a constant, past values, the mean, and both past and current error terms.
Using ARIMA to Predict Patent Filing Trends
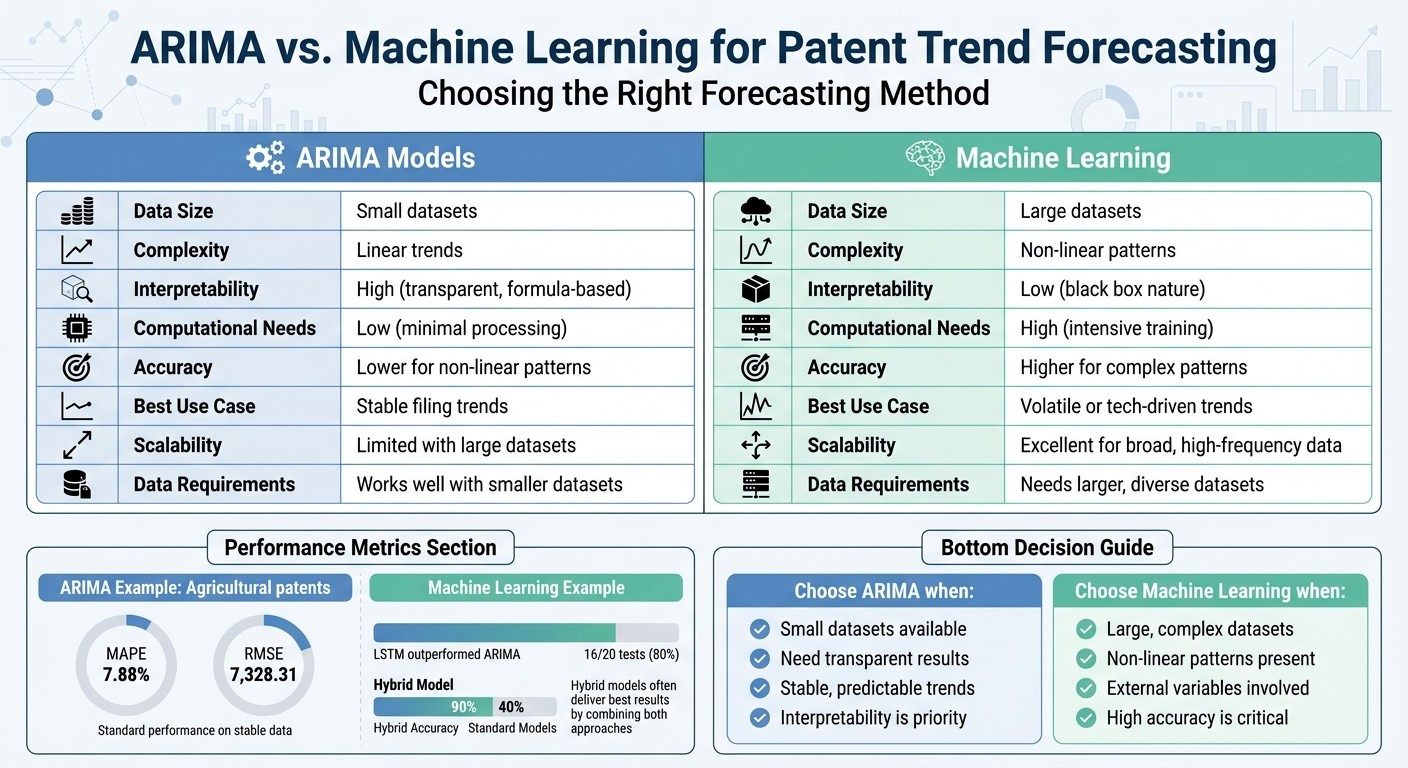
ARIMA is particularly effective for forecasting trends in stable industries. For example, in October 2025, researchers Hüseyin Meral, Yunus Emre Özdemir, and Cuma Akbay used it to analyze patent data from the European Patent Office (EPO) for agricultural innovations (IPC A01). They applied an ARIMA(1,1,0) model, achieving a Mean Absolute Percentage Error (MAPE) of 7.88 and a Root Mean Square Error (RMSE) of 7,328.31. Their findings projected that patent filings in this sector would grow from approximately 150,778 in 2023 to 161,220 by 2028 - highlighting sustained growth in agricultural innovation.
For added precision, AutoARIMA models take this a step further by automating parameter selection. Using tools like the Akaike Information Criterion (AIC) and cross-validation, AutoARIMA minimizes manual errors in identifying optimal parameters. This automation proves invaluable when dealing with complex datasets where patterns aren't easily discernible.
These examples showcase ARIMA's strength in steady, predictable scenarios, setting the stage for a closer look at its limitations and alternatives.
What ARIMA Does Well and Where It Falls Short
ARIMA shines when dealing with linear time-series data that follows relatively stable trends. Its ability to deliver 5-year projections makes it a valuable tool for strategic planning in specific International Patent Classification (IPC) categories. For instance, it can guide R&D investments by providing clear insights into how past patent filing volumes are likely to shape future trends. Another advantage is its interpretability - users can easily understand how the model arrives at its predictions.
Still, ARIMA has its challenges. The model requires the data to be stationary, which often means applying differencing to stabilize the mean. Even then, ARIMA focuses solely on internal patterns, like autocorrelations, and may overlook external factors. For instance, sudden regulatory shifts, economic disruptions, or major technological advances can significantly impact patent filings, and these "cyclical shocks" are often beyond ARIMA's scope. In such cases, machine learning approaches might provide a more comprehensive solution, as we'll discuss in the next section.
Machine Learning Methods for Patent Trend Forecasting
Common Machine Learning Models for Time-Series Forecasting
Machine learning offers a flexible approach to tackling complex forecasting challenges, stepping beyond the structured framework of ARIMA. One standout technique is Artificial Neural Networks (ANN), which excel at identifying non-linear, chaotic, and irregular patterns that traditional models often overlook. By processing data through layers of interconnected nodes, ANNs learn intricate relationships within the data.
Building on this, Long Short-Term Memory (LSTM) networks introduce specialized memory gates that allow them to manage long-term dependencies in time-series data. This feature makes LSTMs particularly effective for long-range forecasting. In fact, LSTM outperformed ARIMA or SARIMA in 16 out of 20 tests, achieving a Mean Absolute Percentage Error (MAPE) as low as 0.002, compared to ARIMA's 30.15. These results highlight how machine learning adapts to scenarios where ARIMA's linear assumptions fall short.
Another noteworthy model is Support Vector Machines (SVM), which are adept at handling non-linear classification and regression tasks. They're especially useful for predicting outcomes like patent grant success or estimating patent value. A study conducted in February 2026 by Semih Kansu and Serkan Altuntas analyzed 12,225 patents from lens.org using various models. Their Random Forest model achieved the highest accuracy for citation forecasting, with an RMSE of 0.0821 and an MAE of 0.0135.
Machine Learning Applications in Patent Data Analysis
Machine learning models shine in their ability to incorporate external predictors, such as applicant history, IPC classifications, and citation networks - elements that standard ARIMA models cannot handle. This is particularly beneficial when analyzing patents, which represent over 90% of global technology information. By processing complex, multivariate inputs, machine learning helps model the unpredictable nature of patent filings with greater precision.
For instance, Bidirectional LSTM (BiLSTM) models can pinpoint patents that are initially overlooked but later become highly cited. A study on citation trajectory prediction demonstrated that combining BiLSTM with Relational Graph Convolutional Networks in a hybrid PTNS model reduced the Root Mean Squared Logarithmic Error (RMSLE) by about 0.18 compared to baseline models.
Natural Language Processing (NLP) further enhances analysis by examining the semantic content of patent claims. This capability aids in predicting approval likelihood and assessing litigation risks, which is crucial given how the wording of claims can significantly impact approval rates and overall success.
Machine Learning Benefits and Trade-offs
The key strength of machine learning lies in its ability to handle complexity. These models can process multiple variables simultaneously, addressing challenges where ARIMA falls short. For example, a hybrid model combining a Support Vector Classifier (SVC) with binomial regression achieved 90% accuracy in predicting patent renewal life at the Indian Patent Office, compared to 40% accuracy from the best-performing standard model, XGBoost.
"AI algorithms display better prediction performance in most applications... while the hybrid statistical-AI models steadily outperform their individual parts, utilizing the best algorithmic features of both worlds." - Vaia I. Kontopoulou et al.
However, there are trade-offs. Machine learning models demand extensive datasets, significant computational resources, and careful tuning. Their "black-box" nature can also make them difficult to interpret. This lack of transparency can be a challenge in patent analytics, where stakeholders need clear reasoning behind strategic decisions.
For smaller datasets (fewer than 125–150 data points), ARIMA or simpler statistical models remain the better choice to avoid overfitting. Ultimately, the decision between ARIMA and machine learning depends on the characteristics of your data, the goals of your forecasting, and the balance you need between interpretability and accuracy.
ARIMA vs. Machine Learning: A Direct Comparison
Side-by-Side Comparison: ARIMA vs. Machine Learning
Now that we've explored each method individually, let's directly compare ARIMA and machine learning to see how they stack up.
ARIMA has been a go-to tool for time-series forecasting for decades, praised for its straightforward mathematical framework and clarity. However, studies frequently show that machine learning algorithms can surpass ARIMA when it comes to identifying non-linear and dynamic patterns. For example, patent data often displays irregular trends, such as patents that are either not renewed at all (0 years) or held until maturity (20 years).
Feature | ARIMA Models | Machine Learning |
|---|---|---|
Data Requirements | Performs well with smaller datasets and linear trends | Needs larger, diverse datasets to handle complex patterns |
Computational Needs | Minimal; relies on simple mathematical processes | High; requires significant processing for training and optimization |
Accuracy | Lower in scenarios involving non-linear or dynamic patterns | Generally higher, especially in complex applications |
Interpretability | High; relies on transparent, formula-based methods | Lower; often labeled as a "black box" |
Suitability for Patent Forecasting | Ideal for stable, linear filing trends | Best for volatile markets and technology-driven transfers |
Scalability | Limited; struggles with large-scale datasets | Excellent; built to handle broad and high-frequency data |
This comparison highlights how blending the strengths of both approaches can lead to more effective forecasting. Each method has its own advantages, and understanding these helps in choosing the right tool based on the data at hand.
"AutoARIMA is like a microscope: precise, lightweight, transparent. Chronos [ML] is like a satellite: broad, deep, and built for scale." - Arnav Jain, Data Analyst
When to Use ARIMA vs. Machine Learning
So, when should you pick ARIMA, and when does machine learning make more sense? Here's a breakdown.
ARIMA is your best bet when you're working with small datasets, need clear and transparent results for stakeholders, or are forecasting straightforward, stable trends in patent filings. It’s also a great choice for establishing a baseline and when interpretability matters more than achieving the highest possible accuracy.
On the other hand, machine learning shines in handling complex, non-linear patterns, especially when high-resolution data or external variables - like applicant history, IPC classifications, or citation networks - are involved. These models excel in fast-paced industries where technology evolves quickly and decision-making factors are intricate. For tasks such as predicting patent renewal probabilities or assessing transaction likelihood, hybrid models that combine statistical techniques with machine learning consistently deliver superior results.
ARIMA Model Explained | Time Series Forecasting
Case Studies: ARIMA and Machine Learning in Practice
Let’s dive into two examples that show how ARIMA and machine learning models have been applied to solve real-world forecasting problems.
ARIMA Case Study: Forecasting Linear Patent Trends
In October 2025, researchers used an ARIMA(1,1,0) model to forecast trends in agricultural patents based on European Patent Office (EPO) data. The model predicted steady growth in patent filings and achieved a Mean Absolute Percentage Error (MAPE) of 7.88 and a Root Mean Square Error (RMSE) of 7,328.31.
ARIMA was chosen because agricultural innovation typically follows long-term strategic trends rather than fluctuating market conditions. This made its linear forecasting capabilities particularly useful for planning budgets and guiding research and development efforts. While ARIMA excelled at capturing these stable, predictable patterns, machine learning shone in tackling more intricate, non-linear data.
Machine Learning Case Study: Predicting Complex Patent Patterns
In June 2024, researchers faced a more challenging problem at the Indian Patent Office: predicting the renewal behavior of 29,145 patents filed between 1995 and 2005. The data showed highly non-linear trends, with patents either being abandoned early (0 years) or renewed to full maturity (20 years). To address this, they created a two-stage hybrid model combining a Support Vector Classifier with binomial regression.
"The proposed hybrid model gives 90% accuracy as compared to the best competitor which gives only 40% accuracy."
The hybrid model first classified patents into categories (never renewed, expired, or matured) and then applied regression to analyze the factors influencing renewal. This approach handled challenges like overdispersion, multilevel clustering, and complex independent variables with remarkable success. It achieved 90% accuracy, far outperforming the 40% accuracy of the standard XGBoost model.
These case studies underscore the importance of aligning the forecasting approach - whether ARIMA or machine learning - with the complexity and nature of the data. Each method has its strengths, depending on the problem at hand.
How to Choose Between ARIMA and Machine Learning
Key Decision Factors
Deciding between ARIMA and machine learning boils down to choosing the right tool for your specific forecasting needs. The choice hinges on four main factors: data characteristics, interpretability, available resources, and the complexity of patterns in your data. These considerations help align the forecasting model to the unique traits of your patent data.
Data characteristics play a central role. ARIMA is particularly effective for stationary or trend-stationary series with clear autocorrelation patterns. For example, if your patent filing data shows predictable linear trends or a single seasonal cycle, ARIMA can provide reliable results. However, datasets with non-linear trends, overlapping seasonal effects, or extreme outliers - like 0-year or 20-year renewals - are better suited for machine learning models, which handle such complexities more effectively.
Dataset size is another critical factor. ARIMA performs well with smaller, well-understood datasets, such as monthly or quarterly patent counts. In contrast, machine learning models often require larger datasets to fully leverage their predictive capabilities. Research has shown that standard machine learning methods may initially underperform on smaller datasets unless hybrid techniques are applied.
The trade-off between interpretability and performance is equally important. ARIMA's simplicity makes it easier to explain results to stakeholders, which is valuable if your organization prioritizes transparency and statistical rigor. On the other hand, machine learning models, while often delivering higher predictive accuracy, can be harder to interpret due to their "black-box" nature.
Finally, consider resource availability. ARIMA requires expertise in identifying stationarity and interpreting ACF and PACF plots, although tools like R's auto.arima can simplify this process. Machine learning approaches demand more advanced skills, such as hyperparameter tuning and feature engineering, along with significant computational resources. Before choosing machine learning, assess whether your team has the necessary expertise and infrastructure.
By carefully evaluating these factors, you can select the approach that best fits your patent forecasting goals.
Using Patently to Support Forecasting Analysis

No matter which forecasting method you choose, properly preparing your data is essential. Tools like Patently make this process more efficient, whether you're working with ARIMA or machine learning models. Patently's AI-powered semantic search and Vector AI technology help patent professionals gather and organize the data they need. Its advanced search filters allow you to quickly identify patent families, filing trends, and citation patterns across specific technologies or time periods.
Patently also supports exploratory data analysis, which is a crucial step before building any forecasting model. Use its analytics tools to understand your data's distribution, detect outliers, and identify seasonal trends. Features like the citation browser and customizable project management tools enable you to segment patent datasets by technology class, filing year, or jurisdiction. This ensures clean, structured inputs that enhance model accuracy.
For teams managing large patent portfolios, Patently's hierarchical project categorization and collaboration features simplify workflows. You can organize patents by technology domain, monitor filing trends across jurisdictions, and export detailed reports that integrate seamlessly into forecasting models. This reduces time spent on manual data preparation, allowing your team to focus on selecting and interpreting the right model for your needs.
Conclusion
Deciding between ARIMA and machine learning models comes down to what you need for your specific situation. ARIMA is straightforward and works well for short-term forecasts and smaller datasets. On the other hand, models like LSTM excel at capturing non-linear patterns and handling long-term dependencies, provided you have enough data. In fact, a study comparing 20 forecasting tests found that LSTM outperformed ARIMA in 16 cases - an impressive 80% of the time.
Interestingly, combining both approaches often produces even better results. A hybrid model can tackle a wider range of challenges by leveraging the strengths of each method. As Vaia I. Kontopoulou from the National Technical University of Athens puts it:
"The hybrid statistical-AI models steadily outperform their individual parts, utilizing the best algorithmic features of both worlds".
This synergy allows ARIMA to handle linear trends effectively, while machine learning models address complex residuals and non-linear dynamics. Together, they create a more versatile and robust forecasting solution.
Ultimately, your choice should reflect your data, expertise, and forecasting goals. For stable and predictable trends with limited data, ARIMA is a reliable option. If you're working in a fast-paced industry with complex variables, machine learning offers the flexibility and power to keep up. Tools like Patently simplify the data preparation process, making it easier for professionals to implement either - or both - approaches.
As the "No-Free-Lunch" theorem reminds us, there’s no one-size-fits-all solution. The best results come from aligning your method with the complexity of your data, the resources at your disposal, and the balance you need between interpretability and predictive accuracy. By doing so, you can generate insights that truly enhance your patent portfolio strategy.
FAQs
How do I know if my patent data is “stationary” enough for ARIMA?
To use ARIMA effectively, your patent data needs to be stationary. This means its statistical properties - like the mean and variance - should remain consistent over time. A common way to check this is by using stationarity tests, such as the KPSS test.
If your data turns out to be non-stationary, don't worry. You can apply transformations like differencing to stabilize it. This step is crucial because ARIMA models rely on stationary data to produce accurate trend forecasts.
What external signals can improve machine-learning patent forecasts?
External factors, such as bibliometric indicators (like citation patterns), geographical and temporal data, and insights from topic modeling of patent content, can strengthen machine learning forecasts. For instance, studying citation trends across specific locations and timeframes can highlight early signs of influence. When these metrics are paired with topic modeling, they offer a clearer view of technological advancements and their potential effects. Together, these signals refine the precision and dependability of patent trend predictions.
How can I combine ARIMA and machine learning in one forecast?
To blend ARIMA with machine learning, you can take a hybrid approach. In this setup, ARIMA handles and removes the linear trends in the data, while machine learning takes on the task of identifying and modeling any remaining nonlinear patterns.
Another option is to integrate the models sequentially. For example, you could use ARIMA’s predictions as an input feature for your machine learning model - or flip it around and feed the machine learning output into ARIMA.
This combination works because it plays to the strengths of both methods: ARIMA excels at linear modeling, while machine learning is better at capturing complex, nonlinear relationships. Together, they can produce more precise forecasts.