5 Tools for Patent Citation Network Visualization
Intellectual Property Management
Apr 3, 2026
Compare five patent citation network visualization tools — from free academic software to enterprise AI platforms.

Patent citation networks reveal how technologies evolve, who influences innovation, and where opportunities lie. With millions of patents and citations globally, manual analysis is impractical. These five tools simplify the process by turning raw data into visual insights:
Gephi: Free, open-source tool for creating interactive maps with up to 100,000 nodes. Ideal for clustering and analyzing relationships.
VOSviewer: Specializes in citation, co-authorship, and text mining. Offers three visualization modes and integrates with major databases.
CitNetExplorer: Tracks the chronological evolution of patents, focusing on how technologies build over time.
VizMAP: Uses a timeline-based layout to show citation relationships and patent pendency, designed for non-technical users.
Patsnap Analytics: Combines AI-driven insights, 3D landscape analysis, and legal data for enterprise-level patent management.
Each tool caters to different needs, from academic research to corporate IP management. Below is a quick comparison to help you choose the right one.
Quick Comparison
Tool | Best For | Key Features | Cost |
|---|---|---|---|
Gephi | Academic research | Interactive maps, clustering, free to use | Free |
VOSviewer | Technology clustering | Text mining, co-citation, flexible formats | Free |
CitNetExplorer | Evolution of technologies | Chronological mapping, temporal focus | Free |
VizMAP | Non-technical users, timeline view | Patent pendency, citation visualization | Paid |
Patsnap | Enterprise IP management | AI insights, legal data integration | Paid (custom pricing) |
Choose based on your technical skills, budget, and analysis goals. Free options like Gephi and VOSviewer are great for researchers, while VizMAP and Patsnap suit professional teams managing global portfolios.
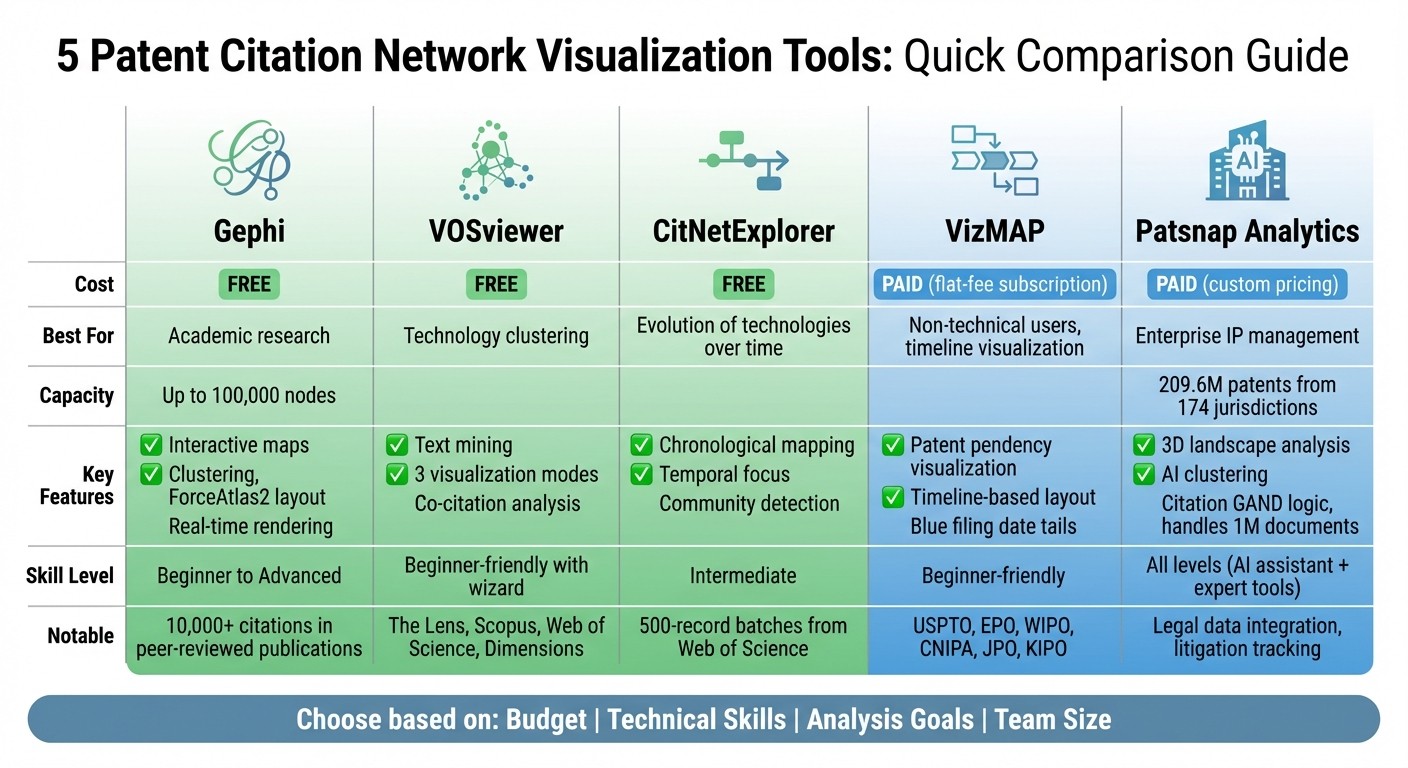
Patent Citation Network Visualization Tools Comparison Chart
PatentNet: Search for the Next Best Invention with Confidence
1. Gephi
Gephi is a free, open-source tool designed for patent citation analysis. It can handle networks with up to 100,000 nodes and 1,000,000 edges, and its original research paper has been cited in over 10,000 peer-reviewed publications. Let’s break down how Gephi brings patent citation network visualization to life.
Visualization Capabilities
Gephi transforms patent data into interactive visual maps using layout algorithms like ForceAtlas2, Fruchterman-Reingold, and OpenOrd. With real-time rendering, you can tweak colors, sizes, and positions dynamically to highlight citation frequency and uncover community clusters.
The platform also comes with built-in statistical tools, such as Modularity Class for detecting communities and PageRank for pinpointing influential patents. For example, a 2026 WIPO analysis used Gephi to map 5,884 drone-related patent documents from the Lens database. Using the Modularity Class algorithm, the study identified 246 distinct communities, revealing relationships between patent assignees that would have been nearly impossible to detect manually.
Data Import/Export Options
Gephi supports a wide range of file formats, including CSV, Excel, GEXF, and GraphML. Its Spreadsheet Import Wizard and dedicated plugins make it easier to map patent connections and analyze co-occurrence data.
When your analysis is complete, you can export your results in high-resolution PNG, PDF, or SVG formats for reports and presentations. You can also save your workspace as a .gephi project file for future use. For quick, browser-based sharing, Gephi Lite - a web version launched in October 2025 - lets you visualize networks without needing to install any software.
Usability for Different Skill Levels
"Gephi is one of the top patent tools for network visualisation that is quite easy to use and to learn." - WIPO Manual on Open Source Patent Analytics
Gephi’s Data Laboratory provides a spreadsheet-like interface for cleaning data without requiring coding skills. However, the desktop version doesn’t include an undo feature, so it’s wise to save your work frequently. Creating publication-ready graphics often involves switching between the Overview and Preview tabs - a workflow commonly called the "Gephi shuffle."
For beginners, Gephi Lite at lite.gephi.org offers a simple starting point without the need for Java configuration. Advanced users, on the other hand, can dive into the desktop version to work with larger datasets and take advantage of its extensive plugin options.
2. VOSviewer
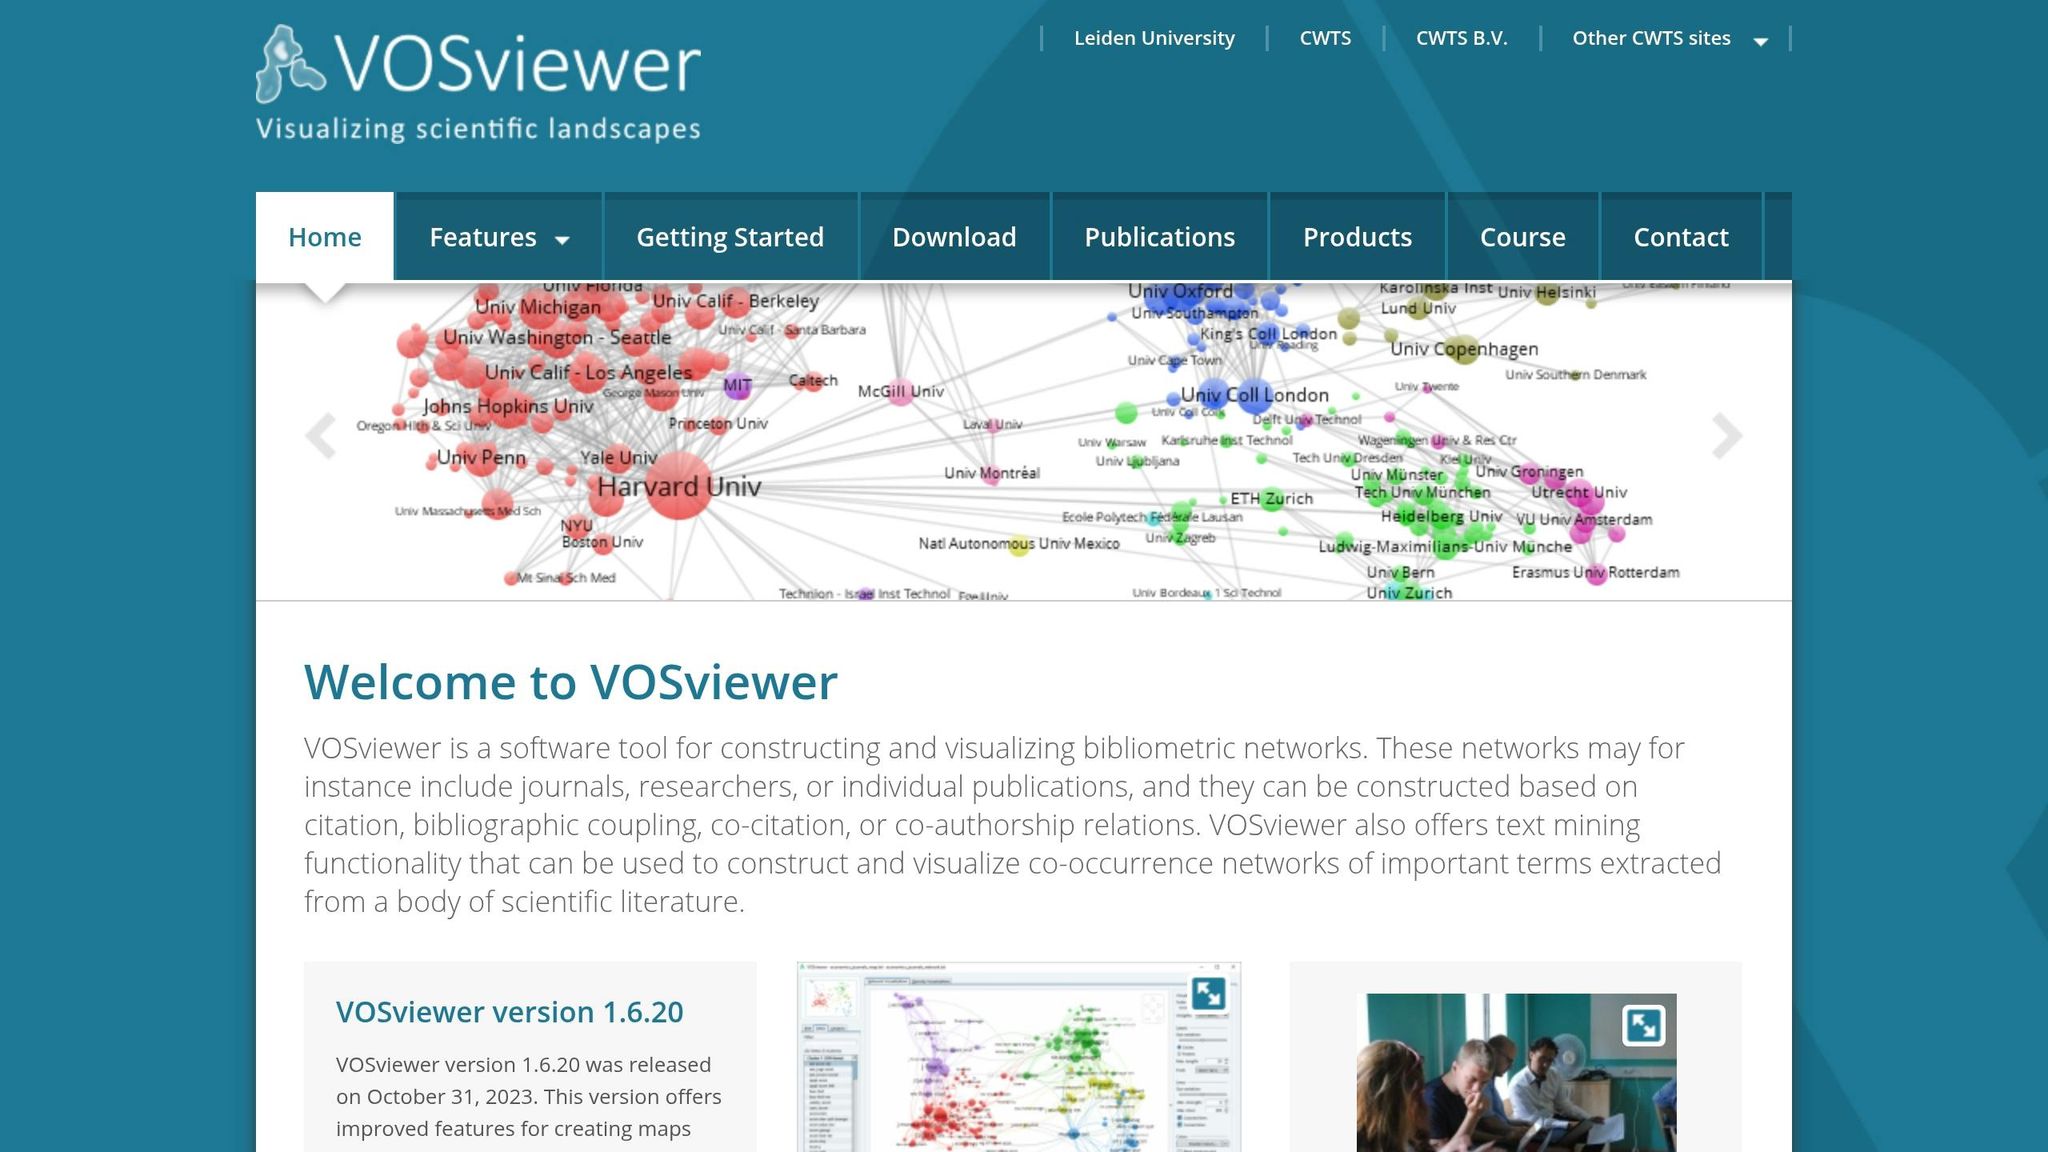
VOSviewer provides a powerful way to explore patent networks, offering distance-based mapping and streamlined data integration. This free, open-source tool, updated to version 1.6.20 on October 31, 2023, is tailored specifically for analyzing citation networks and pinpointing technology clusters.
Visualization Capabilities
The software excels in building networks using various relationships, including citation, bibliographic coupling, co-citation, co-authorship, and term co-occurrence. Each node's size reflects its weight - such as how often a term or citation appears - while color coding highlights clusters or impact levels. For instance, nodes range from blue (lower impact) to red (higher impact).
VOSviewer also features text mining, extracting key terms from patent titles and abstracts using generative AI patent drafting tools to create co-occurrence networks. This capability is essential for mapping out the broader technology landscape. Users can choose from three visualization modes:
Network Visualization: Displays connections between elements.
Overlay Visualization: Tracks impact or temporal trends.
Density Visualization: Identifies areas with high activity concentrations.
These visualization tools are supported by flexible options for importing and exporting data.
Data Import/Export Options
VOSviewer supports a variety of data formats, including CSV files from The Lens, as well as data from Dimensions, Scopus, Web of Science, OpenAlex, and RIS files. However, unlike Gephi, it does not accept Excel files directly, requiring users to rely on specific formats from compatible databases.
The software’s thesaurus feature is a standout. It consolidates variations of assignee names (e.g., "IBM" and "International Business Machines") and unifies synonymous technical terms for cleaner, more accurate mapping. Visualizations can be exported as VOSviewer JSON, Pajek files, or even high-resolution screenshots. For publication-quality images, users can adjust scaling through the 'Screenshot' > 'Options' menu.
With these features, VOSviewer caters to both beginners and advanced users.
Usability for Different Skill Levels
The Create Map Wizard simplifies the process by guiding users step-by-step through data selection and network setup. For those who prefer browser-based tools, VOSviewer Online allows interactive visualizations to be embedded directly into web pages.
The standalone version requires Java (version 8 or higher). macOS users with M1/M3/M4 chips may encounter Java runtime errors, but switching to the JAR version often resolves these issues. For those looking to deepen their skills, a dedicated VOSviewer course is planned for June 16-18, 2026.
Specialized Features for Patent Analysis
VOSviewer’s integration with The Lens makes it especially useful for patent analysis. Since version 1.6.17, the tool has supported creating maps from files exported from this database. Its bibliographic coupling and co-citation analysis capabilities help uncover technological clusters and identify patents with shared foundations.
The thesaurus function is particularly handy for patent data, which often includes various iterations of company names and technical terms. By standardizing these, users can generate more precise visualizations. Additionally, the overlay visualization feature is ideal for tracking patenting trends over time or evaluating the citation impact of specific patents.
3. CitNetExplorer
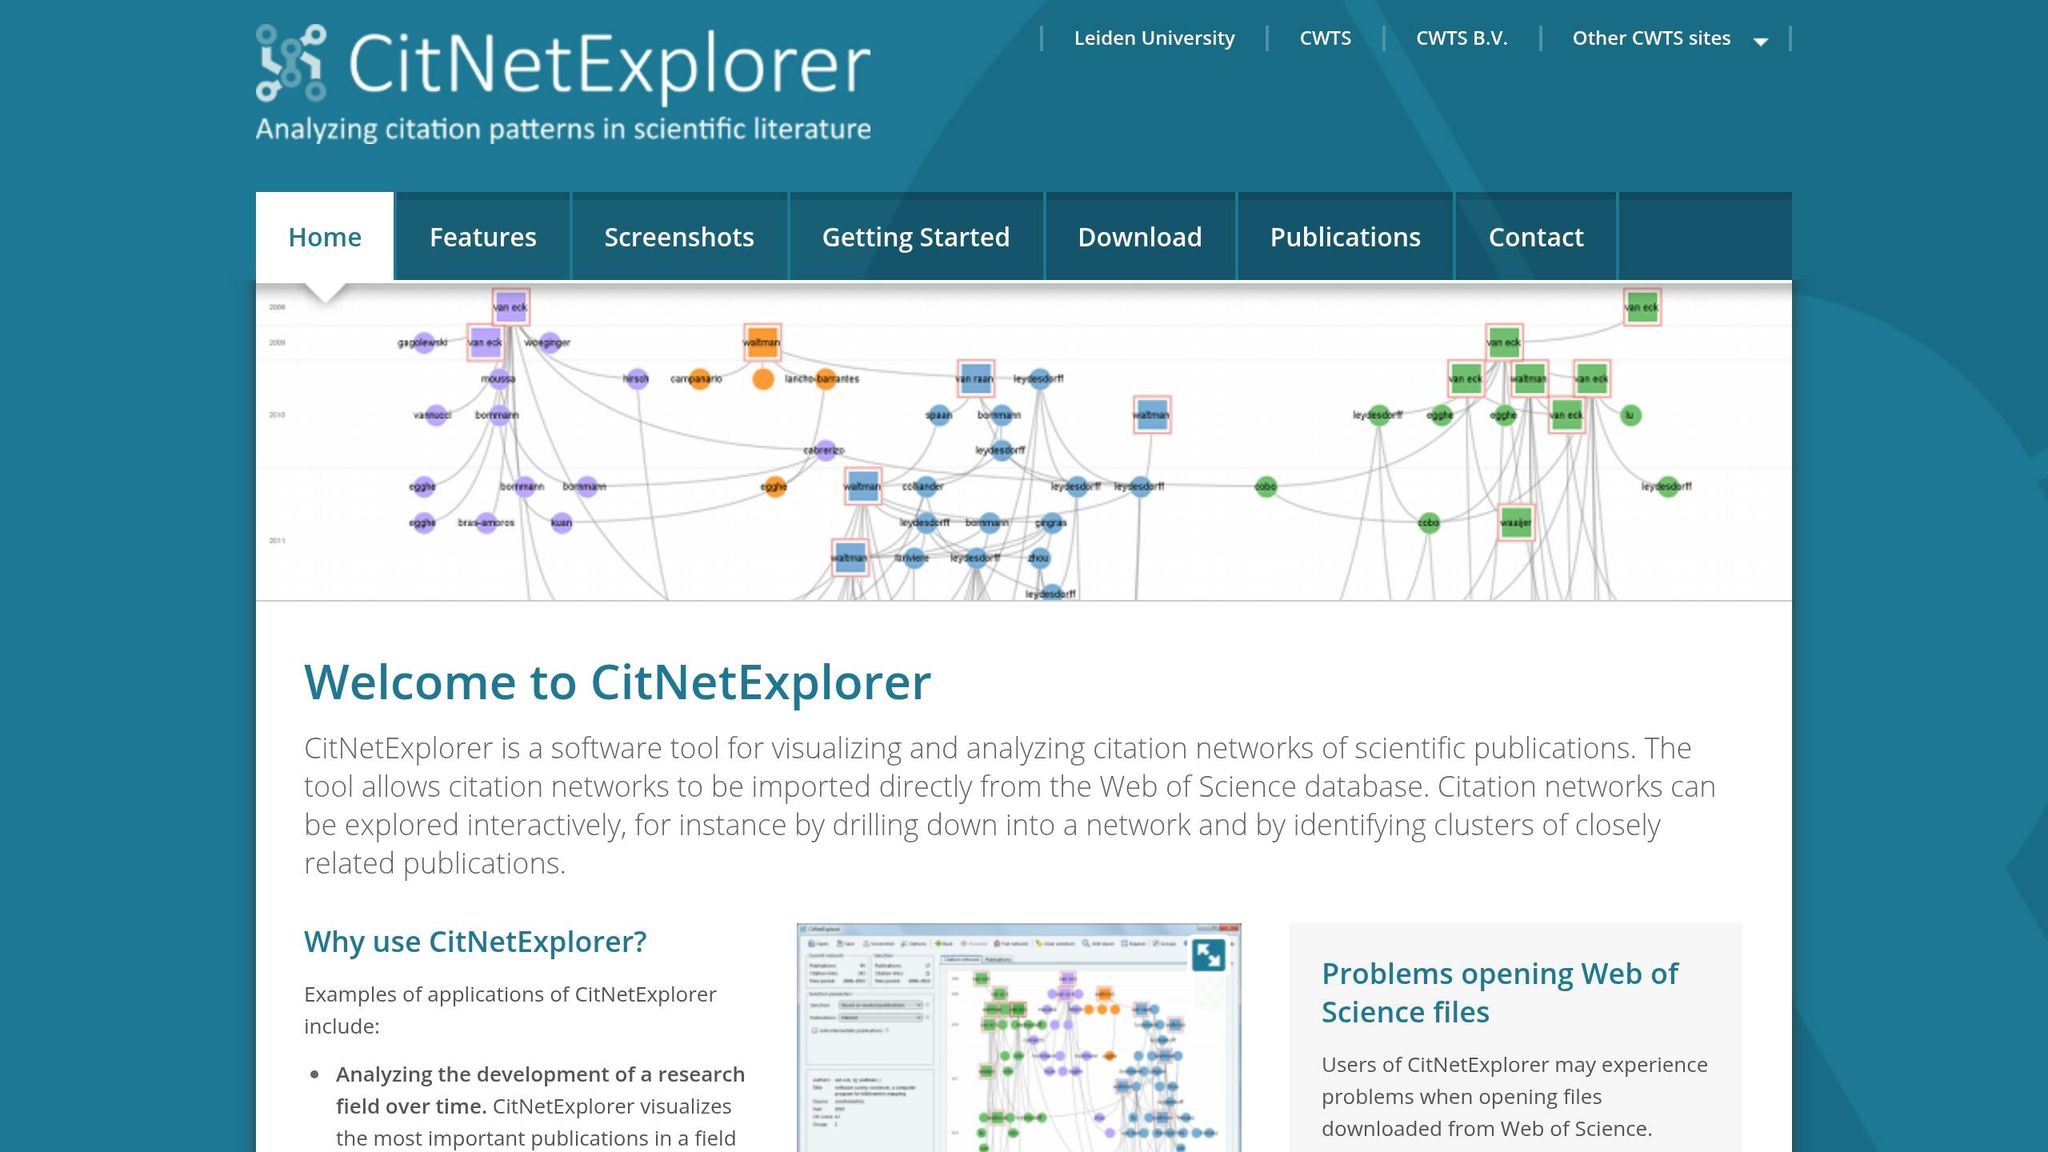
CitNetExplorer is designed to track the chronological development of patent citation networks. Created by the same team behind VOSviewer, this free software specializes in showing how technologies evolve over time through citation relationships. According to the official site, CitNetExplorer "visualizes the most important publications in a field and shows the citation relations between these publications to indicate how publications build on each other". This focus on temporal progression sets it apart from tools that primarily offer cross-sectional mapping.
Visualization Capabilities
The software excels at mapping technological trajectories by highlighting how newer patents are built on earlier foundational ones. For example, researcher Bart Verspagen used CitNetExplorer to analyze the historical development of fuel cell technology, showcasing its ability to uncover specific technological paths. The tool also supports interactive exploration, allowing users to dive into specific segments of a citation network. Additionally, its community detection algorithms group related patents, making systematic reviews more efficient.
Data Import/Export Options
CitNetExplorer directly imports citation networks from Web of Science. However, users must work within a 500-record export limit per batch in plain text format. A key tip: exclude "early access" document types when importing Web of Science data to prevent processing errors. This limitation means users need to carefully manage data batches when analyzing large-scale patent histories.
Usability for Different Skill Levels
CitNetExplorer is particularly well-suited for researchers focusing on the historical evolution of technology. While it doesn't support as many data formats as other tools, its targeted functionality makes it ideal for longitudinal studies. For cross-sectional mapping, VOSviewer remains the better choice.
4. VizMAP
VizMAP, part of IPVision's patent mapping tools, uses a timeline-based layout to illustrate citation networks. Patents appear as boxes along a horizontal timeline - older patents sit on the left, newer ones on the right, with the left edge of each box marking the patent's issue date. Below, you'll find details on its visualization style, ease of use, and data integration features.
Visualization Capabilities
One standout feature of VizMAP is how it highlights patent pendency. Each patent box includes a blue tail that marks the filing date, making it easy to gauge how long the patent prosecution process took. Citation relationships are shown with connecting lines between the boxes, clearly indicating that newer patents on the right cite older ones on the left. This setup maintains the chronological flow of the network.
Usability for Different Skill Levels
VizMAP is designed to make patent data accessible to users with varying levels of technical expertise. Its clear visuals help non-technical stakeholders, like business executives or clients, understand patent trends and relationships without requiring a technical background. To further simplify use, the platform includes a "Guide to Reading Patent Maps", which explains all the visual elements.
Data Import/Export Options
VizMAP connects directly to major patent databases, including USPTO, EPO, WIPO, CNIPA, JPO, and KIPO. Additionally, it offers API access, allowing users to integrate it seamlessly with prosecution management tools and competitive intelligence systems.
5. Patsnap Analytics
Patsnap Analytics builds on earlier tools by combining powerful visualization capabilities with in-depth intellectual property (IP) insights. It taps into a vast repository of over 209.6 million patents from 174 jurisdictions, along with 1.6 billion legal data points and 216.2 million journal articles. With daily updates (as of April 2, 2026), it ensures users have access to the latest information for competitive monitoring.
Visualization Capabilities
This platform stands out with its interactive citation maps, allowing users to explore forward and backward citation relationships between patents. The 3D Landscape Analysis tool employs automatic clustering to highlight technology "peaks", identify whitespace opportunities, and reveal hidden connections. For further customization, the Custom Analysis Suite enables users to generate 2D and 3D charts with metrics like cited-by counts, grant rates, and inventor counts - handling up to 1,000,000 documents at once [3,29,30].
An AI-driven semantic clustering feature categorizes patents and visualizes technology landscapes, improving analysis speed and efficiency.
Caroline Priestley, Head of IP at Suntory, remarked: "Patsnap transforms raw data into actionable insights", emphasizing its practical benefits in professional settings.
These visualization tools set the stage for advanced analytics tailored to patent-specific needs.
Specialized Features for Patent Analysis
Patsnap's Citation GAND logic connects forward and backward citations with actual 102/103 rejection events, identifying blocking relationships and portfolio vulnerabilities. This capability supports critical tasks like Freedom to Operate analyses, invalidation strategies, and licensing negotiations. Moreover, the platform integrates legal intelligence - including litigation data, PTAB decisions, re-examinations, and Standard Essential Patent (SEP) statuses - into its citation maps.
These features make it a versatile tool for analyzing patents from multiple angles.
Usability for Different Skill Levels
Patsnap Analytics is designed to accommodate both novice and experienced users. Features like the Eureka AI assistant and a domain-specific language model help teams with limited technical expertise perform professional-grade research and drafting. For more advanced users, the platform includes expert search tools and Citation GAND logic for deeper competitive intelligence. Collaboration is streamlined through a centralized "Workspace", where IP attorneys and R&D teams can collectively index patents, vote on their relevance, and share insights - all without requiring complex search syntax.
Data Import/Export Options
The platform offers flexible export options, allowing users to save visualizations and data in formats like Excel, PNG, PDF, and BizInt. It also features an IDS Generator for USPTO submissions and API access to integrate with other systems [29,30]. To improve data accuracy, the Standardized Assignee feature resolves the 15% variation often found in corporate name spellings across patent databases.
Tool Comparison
The tools discussed earlier each bring distinct features to the table, and this comparison aims to help you align their functionality with your specific needs.
Selecting the right patent data platform for citation network visualization boils down to factors like your technical skill level, budget, and what you need from the analysis. Free options such as Gephi, VOSviewer, and CitNetExplorer are favored by academic researchers for their ability to create citation maps without incurring ongoing costs. These platforms require some manual setup but allow for tailored analyses, making them flexible for users comfortable with customization.
For professionals handling global patent portfolios, VizMAP - part of IPVision's suite of tools - stands out. It offers strong visualization features under a flat-fee subscription model, which makes it a practical choice for mid-sized law firms and corporate IP departments. On the other hand, enterprise-level solutions like Patsnap Analytics use custom pricing based on specialized modules (e.g., Eureka, Analytics, Bio, Chemical, Synapse). While Patsnap Analytics comes with a higher price tag, it compensates with advanced features like AI-driven automation and collaborative tools that streamline workflows and support team productivity.
Ease of use also varies significantly across these platforms. Gephi and VOSviewer cater to beginners with simplified interfaces like Gephi Lite and the Create Map Wizard. CitNetExplorer focuses on longitudinal studies, offering a more targeted approach. Meanwhile, VizMAP uses a timeline-based layout that simplifies patent trend analysis for non-technical users. Patsnap Analytics strikes a balance by offering an AI assistant for novices while providing expert search tools for advanced users.
Keep in mind that tools with extensive features can become overwhelming if your team lacks the time or expertise to use them effectively. To get the most out of any platform, match its complexity to your team’s skills and workflow. Additionally, think about how well each tool integrates with your existing systems and whether it meets your specific analysis needs.
Conclusion
After reviewing these five tools, it's clear that each caters to specific user needs and preferences. Gephi and VOSviewer are ideal for academic researchers looking for free, flexible options and who don't mind dedicating time to manual configuration. CitNetExplorer is a great fit for those focused on visualizing citation trends over time. For corporate IP teams managing global portfolios, VizMAP provides a simple, timeline-based approach. Meanwhile, Patsnap Analytics shines for organizations needing a feature-rich platform with AI-driven automation, collaborative tools, and integration with litigation and R&D data - though it comes with higher costs.
Most paid platforms offer demos, so it's worth testing them with your actual projects instead of relying solely on generic tutorials. Make sure the tool's complexity aligns with your team's expertise. Even the most advanced platform won't be effective if your team lacks the time or skills to use it properly.
Choose a tool that balances cost and functionality - avoiding unnecessary features while ensuring it meets your analytical needs. The right choice is one that simplifies your patent citation analysis today and has the flexibility to grow with your future requirements.
FAQs
Where can I get patent citation data to import?
You can get patent citation data through two primary sources supported by the USPTO:
USPTO's Enriched Citation API: This provides daily updates, ensuring you have access to the most current data.
PatentsView: Offers bulk downloads, an API, and query tools, making it easier to retrieve and analyze citation data for various projects.
Both options are tailored for users who need reliable tools to analyze or visualize patent citation information.
How do I clean assignee name variations before mapping?
To address variations in assignee names, assignee normalization techniques come into play. Some platforms handle this by automatically standardizing names to account for all possible variants. Others utilize methods like the Jaro-Winkler algorithm or clustering approaches to identify, group, and resolve similar records. These strategies help minimize inconsistencies and ensure assignee names are mapped accurately and consistently.
What is the best tool for visualizing citation history over time?
The Citation Explorer in PatBase is a powerful tool for mapping out citation history over time. It provides a timeline view that displays both backward and forward citations, making it easier to trace connections. Additionally, its citation graphs and trees allow users to examine relationships and trends with clarity.