10 Metrics for Patent Portfolio Optimization
Intellectual Property Management
Jun 6, 2026
Ten metrics to spot weak patents, cut maintenance costs, and align your IP portfolio with business priorities.

Managing a patent portfolio effectively can save millions in unnecessary costs while boosting its impact. This article outlines 10 key metrics that help identify underperforming patents, prioritize valuable ones, and align your portfolio with business goals. From tracking patent family coverage to evaluating citation strength and geographic alignment, these metrics provide a clear framework for making smarter IP decisions.
Key Highlights:
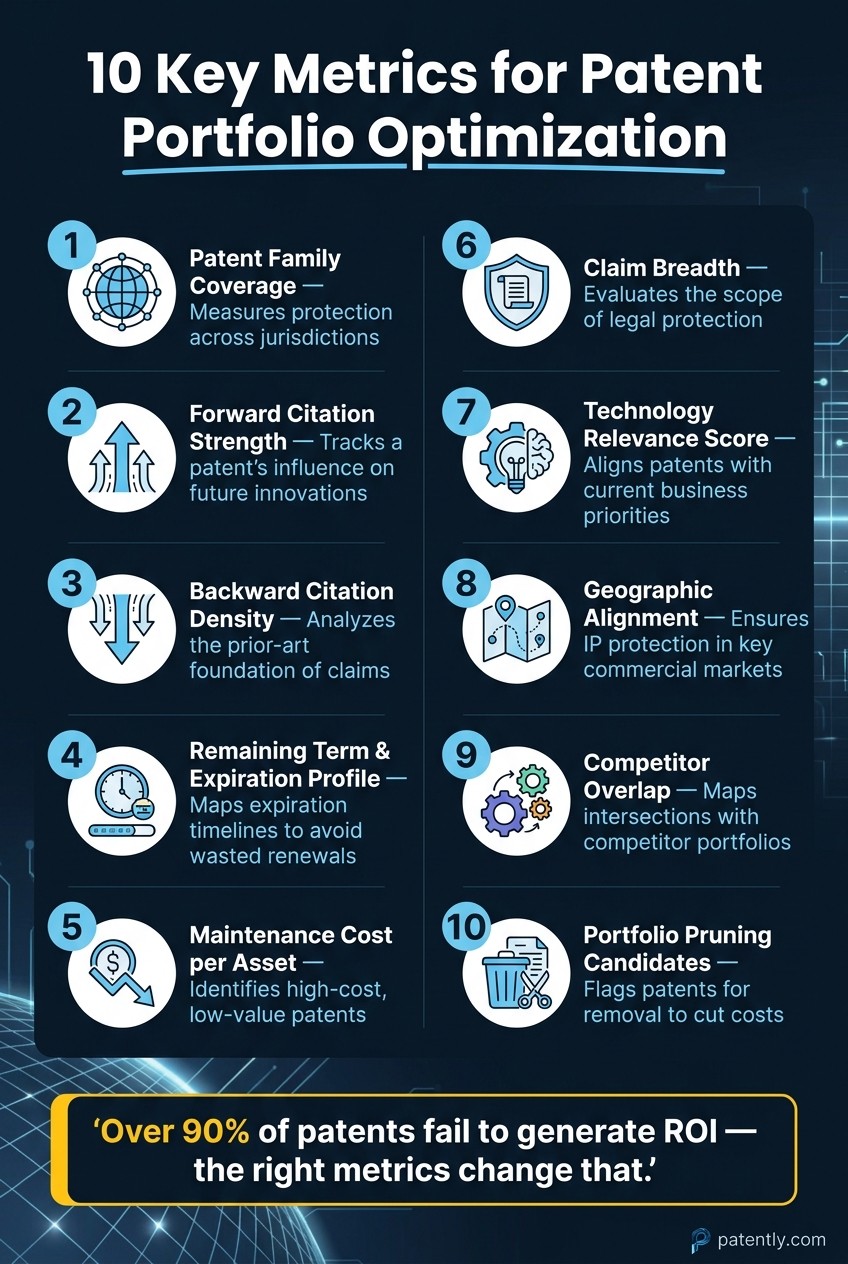
Patent Family Coverage: Measures protection across jurisdictions.
Forward Citation Strength: Assesses a patent's influence on future innovations.
Backward Citation Density: Analyzes the foundation of a patent's claims.
Remaining Term: Tracks expiration timelines to avoid wasted renewal costs.
Maintenance Costs: Identifies high-cost, low-value patents for pruning.
Claim Breadth: Evaluates the scope of protection provided by claims, often optimized during patent drafting.
Technology Relevance: Aligns patents with current business priorities.
Geographic Alignment: Ensures IP protection in key markets.
Competitor Overlap: Maps intersections with competitor portfolios.
Pruning Candidates: Flags patents for removal to cut costs.
Why it matters: Over 90% of patents fail to generate ROI, with billions wasted annually on low-value renewals. Top patent tools and AI can simplify analysis, automate reviews, and optimize portfolios, ensuring every dollar spent supports a commercially relevant asset.
10 Key Metrics for Patent Portfolio Optimization
Using Patent Analytics Dashboards for IP Strategy, Competitor Surveillance, and Portfolio Management
1. Patent Family Coverage
Patent family coverage is a critical metric when it comes to managing and refining patent portfolios. It essentially measures how extensively an invention is protected across different jurisdictions. A patent family groups all filings related to a single invention through a shared priority claim, with filings in major markets forming part of the same family.
What It Measures
This metric tracks the number of jurisdictions where an invention is protected, assesses the legal status of those protections, and assigns weight to each jurisdiction based on its economic importance. Advanced methods often use economic indicators like Gross National Income (GNI) to determine these weights. For instance, the U.S. is typically assigned a value of 1.0, while a Japanese patent might contribute approximately 0.3 to the total market coverage score.
Why It Matters
The size of a patent family often reflects the commercial potential of an invention.
"The number of countries in a patent family speaks volumes about the perceived value and market potential of an invention." - Dr. Dominique Christ, Managing Director, Dennemeyer IP Consulting
For technology-driven businesses, securing coverage in regions like the U.S., Europe, Japan, China, South Korea, and Taiwan is essential. Missing protection in any of these areas creates a gap, leaving room for competitors to operate without infringing on your rights. This underscores the importance of comprehensive coverage in key markets.
How AI Helps
Mapping patent family coverage manually across over 170 jurisdictions is time-consuming and prone to inefficiencies. AI tools simplify this process by aggregating patent family data, filtering by legal status, and identifying geographic "white spaces" - regions where your technology lacks protection. These tools can also categorize gaps by technology class.
Platforms like Patently offer features such as semantic search and family browsing tools, which help visualize global portfolio distribution. This allows teams to quickly identify where additional filings may be needed or where maintenance fees could be reallocated to better align with strategic goals. Ultimately, AI provides a clearer view of where your intellectual property is safeguarded - and where it is not.
2. Forward Citation Strength
Forward citation strength gauges how often a patent is referenced by subsequent filings. Each citation from a later patent contributes to its forward citation count. A patent cited frequently is often considered more influential within its technical domain.
What It Measures
This metric tracks citations a patent receives from filings made after its issuance. However, raw citation numbers alone don't tell the full story. The influence of the citing party matters - a reference from a major industry player carries more weight than one from a smaller entity. Additionally, it's essential to differentiate between examiner citations and applicant citations, as they serve different roles. Parent applications should also be included in the analysis since omitting them could overlook up to 70% of citations.
Citation Source | Primary Purpose | Relevance to Portfolio Value |
|---|---|---|
Examiner citations | Used to support rejection arguments | High - often indicates the patent's blocking power over competitors |
Applicant (IDS) citations | Alerts the examiner to prior art considered | Low - only about 3% are cited in rejection arguments |
By analyzing these details, forward citation strength provides a clearer picture of a patent's impact within its field.
Why It Matters
Like family coverage, forward citation strength offers valuable insights into a patent's commercial potential. Research shows that patents sold or included in brokered packages tend to have significantly higher forward citation counts compared to the average patent. In fact, forward citations can account for up to 45% of the total weight in some patent quality scoring systems.
"Forward citations are a proxy for industry-wide R&D investment in a technology area. With more investment, there are generally more products. With more products, there is a higher chance of infringement. Infringement drives value." - Erik Oliver, Co-founder, Richardson Oliver Law Group
Patents with high citation counts are generally harder for competitors to work around, making them more defensible in licensing discussions or litigation. On the other hand, patents with very few citations over time may be candidates for pruning, allowing resources to focus on assets with greater strategic importance.
However, context matters. For instance, in the pharmaceutical industry, a high citation count might sometimes signal that competitors have designed around the patent rather than built upon it. Interpreting citation data within the framework of your specific technology area is essential.
How AI Helps
Tracking citation patterns manually across a large portfolio is challenging, but AI tools make this process efficient. AI can group patents by citation frequency, map relationships between citations, and flag emerging "hub" patents that sit at the center of technology clusters. Tools like Patently feature a Forward and Backward Citation Browser (FAB), enabling teams to visually explore citation networks and integrate these insights with broader portfolio analyses. This streamlines the process of identifying patents gaining momentum.
AI also adjusts citation metrics for factors like patent age and technology class, which is crucial since older patents naturally accumulate more citations. For patents less than three years old, citation counts are typically too low to draw meaningful conclusions, as the gap between high-value and average patents remains narrow during this period. By automating these adjustments, AI enhances forward citation analysis, helping refine portfolio strategies effectively.
3. Backward Citation Density
While forward citation strength highlights how a patent influences future innovations, backward citation density focuses on the foundation that a patent is built upon. Forward citations show who relies on your patent, while backward citations reveal the prior knowledge and innovations your patent depends on. In essence, backward citation density measures how many prior-art references a patent cites and how concentrated they are, providing insight into the technical groundwork of an invention.
What It Measures
Every patent must reference earlier work to establish its starting point. Backward citation density quantifies the number of these prior-art references and their sources. These references can originate from five areas: applicant Information Disclosure Statements (IDS), examiner citations, Office Actions, literature, or prior art searches conducted by intellectual property offices.
Each source of citation offers unique insights:
Applicant (IDS) Citations: These highlight what the applicant believes is necessary to acknowledge to operate legally, providing a glimpse into competitive awareness.
Examiner Citations: These define the boundaries of patentability, reflecting the legal framework of the invention.
Self-Citations: These indicate continuity in a company’s research and development efforts, often linking the patent to the company’s core product lines.
Citation Source | What It Reveals | Strategic Value |
|---|---|---|
Applicant (IDS) | Competitive awareness | Reflects knowledge of competitors |
Examiner Citations | Legal relevance | Defines the legal scope of the patent |
Self-Citations | R&D continuity | Shows alignment with core products |
By examining backward citation density, you can complement forward citation insights, creating a more complete picture of a portfolio's strengths and weaknesses.
Why It Matters
Backward citation density is a key metric for evaluating patent quality and aligning it with broader strategic goals. While a high density often suggests incremental innovation built on a well-developed knowledge base, a low density might indicate a highly original invention with fewer precedents.
Self-citations, in particular, provide valuable clues about a company’s R&D strategy. A patent that frequently cites earlier filings from the same company suggests strong continuity and alignment with active product development. This can help identify patents that are likely tied to current or future product lines.
However, there’s a catch: not all citations are meaningful. Studies suggest that up to 50% of patent citations may be "noise" - references without any real technological connection to the invention. As Jaffe et al. explain:
"There is, however, a large amount of noise in citations data; it appears that something like one-half of all citations do not correspond to any perceived communication, or even necessarily to perceptible technological relationship between the inventions."
To draw accurate conclusions, it’s essential to contextualize citation density by technology class and patent family.
How AI Helps
Sorting through hundreds of backward citations manually is time-consuming and inefficient. AI tools simplify this process by filtering out irrelevant references and highlighting the citations that influenced claim amendments or rejections during prosecution. This ensures that only meaningful citations are considered, cutting through the "noise".
AI also uses network metrics like betweenness and closeness centrality to identify patents that bridge different technical areas. These "bridging patents" often hold significant strategic importance, as they connect distinct domains and can strengthen a portfolio’s value. Tools like Patently’s Forward and Backward Citation Browser (FAB) allow teams to visually map citation networks, making it easier to identify clusters of related prior art and assess whether a patent is deeply rooted in existing knowledge or stands out as original.
Additionally, AI can analyze self-citations to uncover patterns of R&D continuity. This helps companies decide which patents to prioritize, license, or let lapse, based on their alignment with current business objectives.
4. Remaining Term and Expiration Profile
Patents don't last forever. Knowing how much time is left on each patent and mapping those expiration dates across your portfolio gives IP teams the clarity they need to make smart decisions about renewals and pruning before deadlines hit. Here's how to measure remaining terms and plan for expirations effectively.
What It Measures
This metric looks at how much time remains on each patent, from today’s date until expiration. In the U.S., utility patents typically last 20 years from their filing date, although Patent Term Adjustments (PTA) can sometimes extend this period. By mapping expirations across the portfolio, you can categorize assets into near-, mid-, and long-term expirations. This approach highlights potential "expiration cliffs" - periods where many patents lose protection at once.
Why It Matters
Maintenance fees rise as patents age. In the U.S., these fees are due at 3.5, 7.5, and 11.5 years, with costs increasing at each stage. For example, at the 11.5-year mark, a small entity might pay roughly $7,400 per patent. Paying such high fees for patents that no longer align with your strategy or products is a waste of resources.
Patents with limited remaining terms also have reduced enforcement potential. A patent with fewer than 3–5 years left may not justify the expense of litigation, especially since lawsuits often take 2–4 years to resolve. If the patent expires during the case, the opportunity for enforcement is lost.
"The goal is not simply to cut costs. It is to ensure that every maintenance dollar supports a defensible, commercially relevant asset." - Patlytics
On the other hand, patents with longer remaining terms can open doors for strategic moves. These assets might support continuations to capture evolving technologies or serve as barriers to competitors’ product developments.
How AI Helps
Tracking expiration dates manually in spreadsheets is tedious and prone to mistakes. AI-powered dashboards simplify the process by organizing patents into groups based on their maintenance windows. This allows teams to plan proactively and make decisions backed by data.
The benefits are clear. For instance, in early 2026, a Director of IP Strategy used AI tools to analyze 1,000 patents nearing their 11.5-year renewal deadline. By identifying low-value assets early, the team saved $1.06 million in maintenance fees, achieving a 4,140% ROI.
"What used to take months now takes a single day with decisions based on data, not guesswork." - Director of IP Strategy, Global Tech Company
Tools like Patently's C-Tree visualization make it easy to explore priority claims and family relationships, ensuring no critical expiration dates or legal events are missed. Features like relevance scoring help flag patents with short remaining terms and low commercial value, making them prime candidates for pruning.
Maintenance Window | Approx. Small Entity Fee | Key Question to Ask |
|---|---|---|
3.5 Years | ~$2,000 | Does this patent align with current R&D? |
7.5 Years | ~$3,600 | Have competitors designed around this claim? |
11.5 Years | ~$7,400 | Is the remaining term long enough to enforce? |
5. Maintenance Cost per Asset
What It Measures
This metric tracks the cost of maintaining patents, whether by individual assets, patent families, or jurisdictions. In the U.S., utility patents require three maintenance payments during their lifespan - at 3.5, 7.5, and 11.5 years after being granted. In contrast, most other countries charge annual fees, referred to as annuities, which typically range from $2,000 to $5,000 per country, per year. These fees often increase as the patent ages. For example, even a modest international patent portfolio can accumulate annual maintenance costs between $50,000 and $100,000.
Why It Matters
Many companies default to paying every maintenance fee for every patent without evaluating whether it’s worth the cost. Russ Krajec, Principal at BlueIron IP, describes this practice as:
"The default at most companies is to pay every maintenance fee on every patent, every time... This is waste by autopilot."
The problem is that maintenance fees don’t always align with the value of the patents themselves. Older patents, which are often less relevant commercially, tend to carry the highest fees. Matthew A. Anderson, VP and Chief IP Counsel at Medtronic, highlights this discrepancy:
"Although each patent has a different value to the business, the costs to file, prosecute, and maintain each patent don't reflect this disparity."
For larger portfolios, these costs can become overwhelming. Take Google, for instance: maintaining its approximately 28,000 U.S. patents is projected to cost an eye-watering $352 million over their lifetimes. This is where AI can step in to transform these costs into strategic opportunities.
How AI Helps
AI tools can turn maintenance decisions into a strategic process rather than a routine compliance task. By automating the categorization of patents into "keepers" and "pruning candidates", AI evaluates factors like citation relevance, product connections, and market impact. This eliminates the need for labor-intensive manual reviews, which can eat up about 75% of the potential savings from abandoning a patent.
Medtronic’s use of AI offers a clear example of the potential savings. In 2025–2026, under Anderson's leadership, the company implemented the "SPARK" method - Strategic alignment, Prioritizing value, Advance with AI, Recognition, and Knowledge management - across its 40,000-patent portfolio. By strategically cutting high-cost, low-value patent families, Medtronic reduced its annual IP expenses by 10% while simultaneously improving the quality of its portfolio. Tools like Patently make this process even easier, helping teams quickly identify low-value patents so budgets are guided by data rather than outdated habits.
Jurisdiction | Fee Timing | Approx. Official Fees (Large Entity) |
|---|---|---|
United States | 3.5, 7.5, and 11.5 years post-grant | $2,150 / $4,040 / $8,280 |
Europe (EPO) | Annually from Year 3 | €725 to €1,865 per year |
Japan | Annually from Year 4 | ¥10,300 + ¥800/claim (Years 4–6) |
Australia | Annually from Year 4 | AU$300 to AU$2,815 per year |
South Korea | Annually from Year 4 | ₩36,000 + ₩20,000/claim (Years 4–6) |
6. Claim Breadth
What It Measures
Claim breadth refers to the scope of a patent's independent claims, which essentially set the boundaries of its legal protection. A broad claim focuses on the functionality of an invention - what it achieves - while a narrow claim zeroes in on the specific method or process used to achieve that outcome. Broad claims can act as strong barriers in the market, making it harder for competitors to maneuver around them. On the other hand, narrow claims are more vulnerable to being bypassed. This distinction is key to understanding how strategic claim breadth shapes a patent's value.
Why It Matters
The breadth of a patent's claims directly impacts its strength and overall value. Broad claims not only make patents harder to challenge but also increase their worth within a portfolio. As Hayat Amin, CEO of Beyond Elevation, aptly explains:
"A patent on a feature nobody copies is not defensible - it is irrelevant. A patent on a feature every competitor needs and cannot design around is a weapon."
Here’s a stark reality: 83% of startup patent portfolios fail at least 4 out of 7 key defensibility criteria. Narrow or poorly aligned claims often contribute to this failure, especially when they don’t connect to revenue-driving features. In mergers and acquisitions (M&A), portfolios with broader, strategically aligned claims can command 2x to 4x higher multiples compared to weaker ones.
The practical test for claim breadth is simple: if every independent claim ties directly to a feature customers pay for - or a capability competitors can’t avoid - it holds commercial value. Otherwise, it’s just an expense.
Take the example of a startup evaluated by Beyond Elevation. Initially, the founders estimated their patent portfolio to be worth $2 million. However, a defensibility review revealed a score of just 2 out of 7. Beyond Elevation restructured the strategy to focus on core revenue-generating technologies and expanded geographic protection. Eighteen months later, the portfolio was valued at $14 million during licensing negotiations, ultimately closing at $11 million - a 5.5x increase in value.
How AI Helps
Traditional claim analysis is time-consuming and inconsistent. AI tools significantly speed up this process. Using natural language processing (NLP), these tools break down claims into their core components - preamble, transition, and body - making it easier to pinpoint ambiguities and overly specific limitations. What used to take days can now be completed in less than a day.
AI doesn’t just parse claims; it also identifies problematic language, such as absolute terms like "each" or "every", which create loopholes for competitors. It can flag risks of divided infringement, where multiple parties would need to perform different steps, and even score claims based on their breadth by analyzing the number and specificity of limitations. Platforms like Patently integrate these capabilities into a single workflow, allowing IP teams to quickly identify which claims are strong, which need improvement, and which should be discarded.
AI Method | Purpose in Claim Analysis | Maturity Score |
|---|---|---|
NLP-Based Claim Parsing | Breaks down claims to identify ambiguities and functional elements | 88 / 100 |
Transformer Prior Art Retrieval | Locates semantically similar disclosures across languages to test claim validity | 82 / 100 |
Machine Learning Validity Scoring | Analyzes prosecution history and claim breadth to assign a probabilistic score | 74 / 100 |
Claim Scope Mapping | Visualizes relationships between claims and embodiments to evaluate boundaries | 61 / 100 |
7. Technology Relevance Score
What It Measures
This score is all about connecting the dots between your patent portfolio and your company’s strategic goals. The Technology Relevance Score evaluates how closely each patent aligns with your current products, R&D priorities, and market strategies. Unlike the typical IPC/CPC classification codes, this metric uses your company’s unique business taxonomies - specific product categories or technology focus areas - to measure relevance. Some frameworks even refine the results by accounting for factors like citation practices across patent offices, the age of the patent, and its technology field. This ensures scores are consistent and meaningful across diverse portfolios. Essentially, it ties technical details to real-world business priorities.
Why It Matters
Here’s a stark reality: 20–30% of patents maintained by companies add little or no strategic value. Yet, global patent maintenance fees rack up to a staggering $15 billion annually. The Technology Relevance Score helps companies move beyond the outdated mindset of “how many patents do we own?” to a much sharper question: “how many of these patents actually matter right now?”
This metric can make portfolio management more focused. For instance, patents scoring below 30% can be flagged as candidates for pruning, allowing companies to redirect resources toward patents that actively contribute to revenue or strategic goals.
How AI Helps
Manually analyzing thousands of patents against constantly evolving product strategies is nearly impossible. Enter AI. With the help of AI tools, your company’s taxonomy labels can be applied to the entire portfolio automatically. These tools can categorize over 2,500 patents in under 18 minutes - a process that would otherwise take weeks by hand. By leveraging supervised machine learning and large language models (LLMs), AI can classify both established and emerging technologies with an impressive 97% accuracy.
Beyond classification, platforms like Patently offer features such as infringement heatmaps. These heatmaps rank patents as High, Medium, or Low based on how well their claims align with current market products. A patent with a "Low" heatmap score and no alignment with R&D becomes an easy candidate for pruning during maintenance fee cycles. AI also identifies whitespace - areas where your R&D focus lacks IP protection - giving your team a chance to act before competitors step in.
8. Geographic Alignment
What It Measures
Geographic Alignment looks at whether your patent filings align with your business footprint. In simpler terms, it asks: Are you protecting your intellectual property in the regions where you operate commercially? This involves assessing patent family coverage in key markets like the U.S., Europe, Japan, China, South Korea, and Taiwan. By identifying gaps in your filing strategy, you can better understand the potential market impact and control unnecessary costs.
Why It Matters
The numbers tell a compelling story. If your patent portfolio is limited to the U.S., you could be leaving 60% of the global market unprotected.
"Filing everywhere without strategic analysis can become one of the most expensive self-imposed taxes a company can create." - Gene Quinn, Patent Attorney
For example, pursuing patents in five countries can cost anywhere from $45,000 to $75,000 just to secure a grant. Now, imagine scaling that across hundreds of patents in regions that don’t align with your business goals - it’s a quick path to skyrocketing expenses. Geographic alignment ensures that each patent serves a clear purpose, reinforcing earlier discussions on coverage and return on investment.
"Gaps in geographic coverage represent enforcement blind spots." - PerspireIP
How AI Helps
Addressing these challenges, AI simplifies the alignment process. Instead of manually sifting through data, AI tools can aggregate and visualize patent coverage gaps. For instance, Patently uses Vector AI to match related patents across languages, making it easier to identify where your portfolio might lack protection.
AI doesn’t stop at gap detection. Advanced platforms incorporate macroeconomic indicators like GDP and regional patent activity, combining them with technology trends. This helps teams prioritize jurisdictions strategically rather than relying on outdated filing habits. The 30-month PCT window becomes a powerful decision-making tool when paired with real-time market and competitor data, enabling smarter national phase entry choices.
Companies that regularly review their geographic alignment are seeing tangible benefits. Some report that by trimming geographically irrelevant patents, they’ve reduced their portfolios by 30% while increasing their value by 40%. A leaner, more focused portfolio often outperforms one that’s bloated with misaligned assets.
9. Competitor Overlap
What It Measures
Competitor Overlap evaluates how much your patent portfolio intersects with those of your competitors within the same technology domain. It highlights areas with dense patent activity and uncovers "white spaces" - innovation zones with limited patent filings. This metric also assesses the quality and focus of shared claims, helping you determine whether your portfolio is positioned to defend your market share, challenge competitors, or maintain a balanced stance. It builds on prior metrics by introducing a competitive lens to your intellectual property strategy.
Why It Matters
Understanding where your portfolio overlaps with competitors' can guide smarter decisions in research, development, and patent filings. For instance, if a competitor is aggressively securing patents in a critical technology sector, overlap analysis can help you decide whether to fortify your position defensively or explore less saturated areas. It also provides valuable insights for mergers and acquisitions, pinpointing potential targets with patents that align strategically with your goals.
The stakes couldn’t be higher. As of 2023, intellectual property assets make up nearly 90% of the total market value of S&P 500 companies. A significant overlap with a well-funded competitor isn't just a strategic challenge - it can lead to litigation risks and weaken your leverage in licensing negotiations.
For example, an analysis by LexisNexis PatentSight+ in April 2026 revealed that while IBM held the most patents, Alphabet scored the highest in "Competitive Impact." The study also noted that the top 10 companies controlled just 25% of portfolio quality within the space, indicating a fragmented landscape and opportunities for new players.
"Competitive Impact is a patent family–level indicator... that represents the individual strength and business value of a patent family." - LexisNexis Intellectual Property Solutions
How AI Helps
Artificial intelligence takes competitor overlap analysis to the next level. Traditional methods of analyzing competitors are often time-consuming and prone to errors. AI, however, can perform semantic analysis across vast numbers of patents, grouping claims by meaning and uncovering overlaps that standard IPC/CPC code searches might miss.
For example, AI-powered tools can categorize over 2,500 patents in less than 18 minutes with up to 97% accuracy. This level of speed and precision replaces weeks of manual work by legal teams. Moreover, custom taxonomy mapping enables the reclassification of competitors' portfolios to align with your product lines, clearly showing where their R&D efforts intersect with your business priorities.
Tools like Patently further enhance these insights. Features such as Vector AI and citation browser capabilities allow teams to conduct in-depth competitive analysis. They can trace citation networks to identify key patents that competitors rely on, including foundational or "blocking" patents in critical technology areas. These tools also support continuous monitoring, alerting you in real-time when a competitor's new filings encroach on your protected areas, eliminating the need to wait for periodic reports.
10. Portfolio Pruning Candidates
As the final metric in the checklist, identifying pruning candidates helps ensure your patent portfolio stays both cost-efficient and strategically aligned with your business goals.
What It Measures
This metric focuses on spotting patents that no longer justify their costs. These might be patents with low business value, overlapping coverage, or misalignment with your current products, revenue streams, or R&D efforts. Metrics like forward citations, claim breadth, remaining term, geographic reach, and commercial alignment are used to make these determinations. For example, a patent for a compound abandoned during Phase II trials offers no commercial alignment, no matter how strong its claims are. The same principle applies across industries - if a patent doesn't protect something you're selling, licensing, or actively developing, it’s a clear candidate for removal.
Understanding these metrics is critical because high maintenance fees paired with low strategic relevance make pruning a necessity.
Why It Matters
Maintaining a single U.S. patent for its full term costs roughly $14,470 in official fees alone. Globally, companies are expected to spend over $177 billion on renewal fees in the next 20 years, with almost $10 billion due in 2026. Notably, about 71% of maintenance costs occur after year 10, a point at which many patents have already lost their strategic importance.
Internal reviews at companies heavily invested in intellectual property reveal that fewer than 15% of patents actively contribute to revenue through exclusivity, licensing, or enforcement. The rationale for pruning is clear. For example, in March 2026, a mid-sized electronics company found that 18% of its patents lacked measurable business value. Letting these patents lapse saved the company over $2 million annually in maintenance fees. Intel provides another example, having reduced its portfolio by 21.7% between 2020 and 2025. By cutting its lowest-quality patents, Intel retained its highest-value assets and streamlined its portfolio.
"Allowing non-strategic patents to lapse is not failure; it is discipline." - Gene Quinn, Patent Attorney
How AI Helps
With the high costs and limited revenue impact of underperforming patents, AI simplifies the process of identifying pruning candidates. Instead of relying on manual reviews, AI tools integrate multiple quality indicators - such as citation strength, claim language, lifecycle stage, and geographic reach - into a single score for each patent.
A proven method is the "bottom-up" approach: AI scoring is used to flag the bottom 50–80% of patents lacking citations or market relevance. Human experts can then focus their attention on the remaining high-value assets. For example, Fujitsu used this strategy from 2020 to 2025, cutting about 60% of its lowest-performing patent families and boosting overall portfolio quality by 17.7%, as measured by its Portfolio Improvement Index.
Patently supports this process with tools like semantic search and citation analysis, helping teams quickly identify patents with weak claim coverage or limited citation networks. By combining these insights with lifecycle tracking, teams can automate rules to flag low-scoring patents approaching renewal deadlines. This ensures decisions are made proactively, reducing last-minute pressure. Redirecting resources to high-value patents enhances the overall strength of the portfolio.
Conclusion: Making Better Portfolio Decisions with the Right Metrics
Key Takeaways
Choosing the right metrics can turn your patent portfolio into a major strategic advantage. The 10 metrics outlined here evaluate different aspects of portfolio health - such as quality, cost, and relevance - while ensuring alignment with your business goals. It's worth noting that intellectual property assets make up roughly 90% of the total market value of S&P 500 companies.
Unfortunately, many patents fail to deliver value, often due to poor management. Conducting annual reviews can help you maintain a leaner, more impactful portfolio.
"Patent strategy without economic modeling is guesswork that will be dismissed by business leadership." - Gene Quinn, Patent Attorney
To gain buy-in from finance and executive teams, it's essential to present patent data in terms of ROI and risk management. By doing so, you underline the importance of using AI-driven metrics to refine and enhance your portfolio's overall performance.
Next Steps
With these insights, you can start making smarter, more strategic portfolio decisions right away. Use this checklist during your next quarterly review, and bring in leaders from R&D, Finance, and Strategy to ensure your IP choices align with broader business objectives.
Patently offers tools like semantic search, citation analysis, and lifecycle tracking to help you continuously and automatically monitor your portfolio. This approach is especially important in an era where technology evolves rapidly, and renewal deadlines are always around the corner.
FAQs
Which 3 metrics should I start with first?
Start by focusing on three essential metrics to ensure your intellectual property (IP) aligns with business goals and maintains a healthy portfolio:
Revenue Coverage: Keep an eye on the percentage of revenue generated by products safeguarded by your core patents. This helps you gauge how well your IP supports business success.
Competitive Impact: Pay attention to forward citations and market coverage. These indicators reveal how your patents influence innovation and competition in your industry.
Portfolio Pruning Rate: Regularly review and eliminate low-value assets. This allows you to concentrate resources on patents that drive meaningful innovation.
How do I score patents for pruning decisions?
To evaluate patents for pruning, use a mix of quantitative metrics and business relevance. Begin by applying data-driven filters such as forward citations, family size, patent lifespan, and claim details to identify lower-priority assets. Next, align these patents with current product lines, strategic objectives, and potential licensing or enforcement opportunities to assess their importance. A combined quality score can then guide prioritization and decision-making efficiently.
When are citation metrics too early to trust?
Citation metrics often fall short early in a patent's lifecycle because of citation lag - the time it takes for a patent to be referenced by other documents. This delay is particularly pronounced in rapidly evolving tech industries, where data can remain sparse for a while, giving a skewed picture of the patent's contribution. Since citation counts reflect past activity, depending on them too early can lead to misleading conclusions about a patent's importance in its field.